
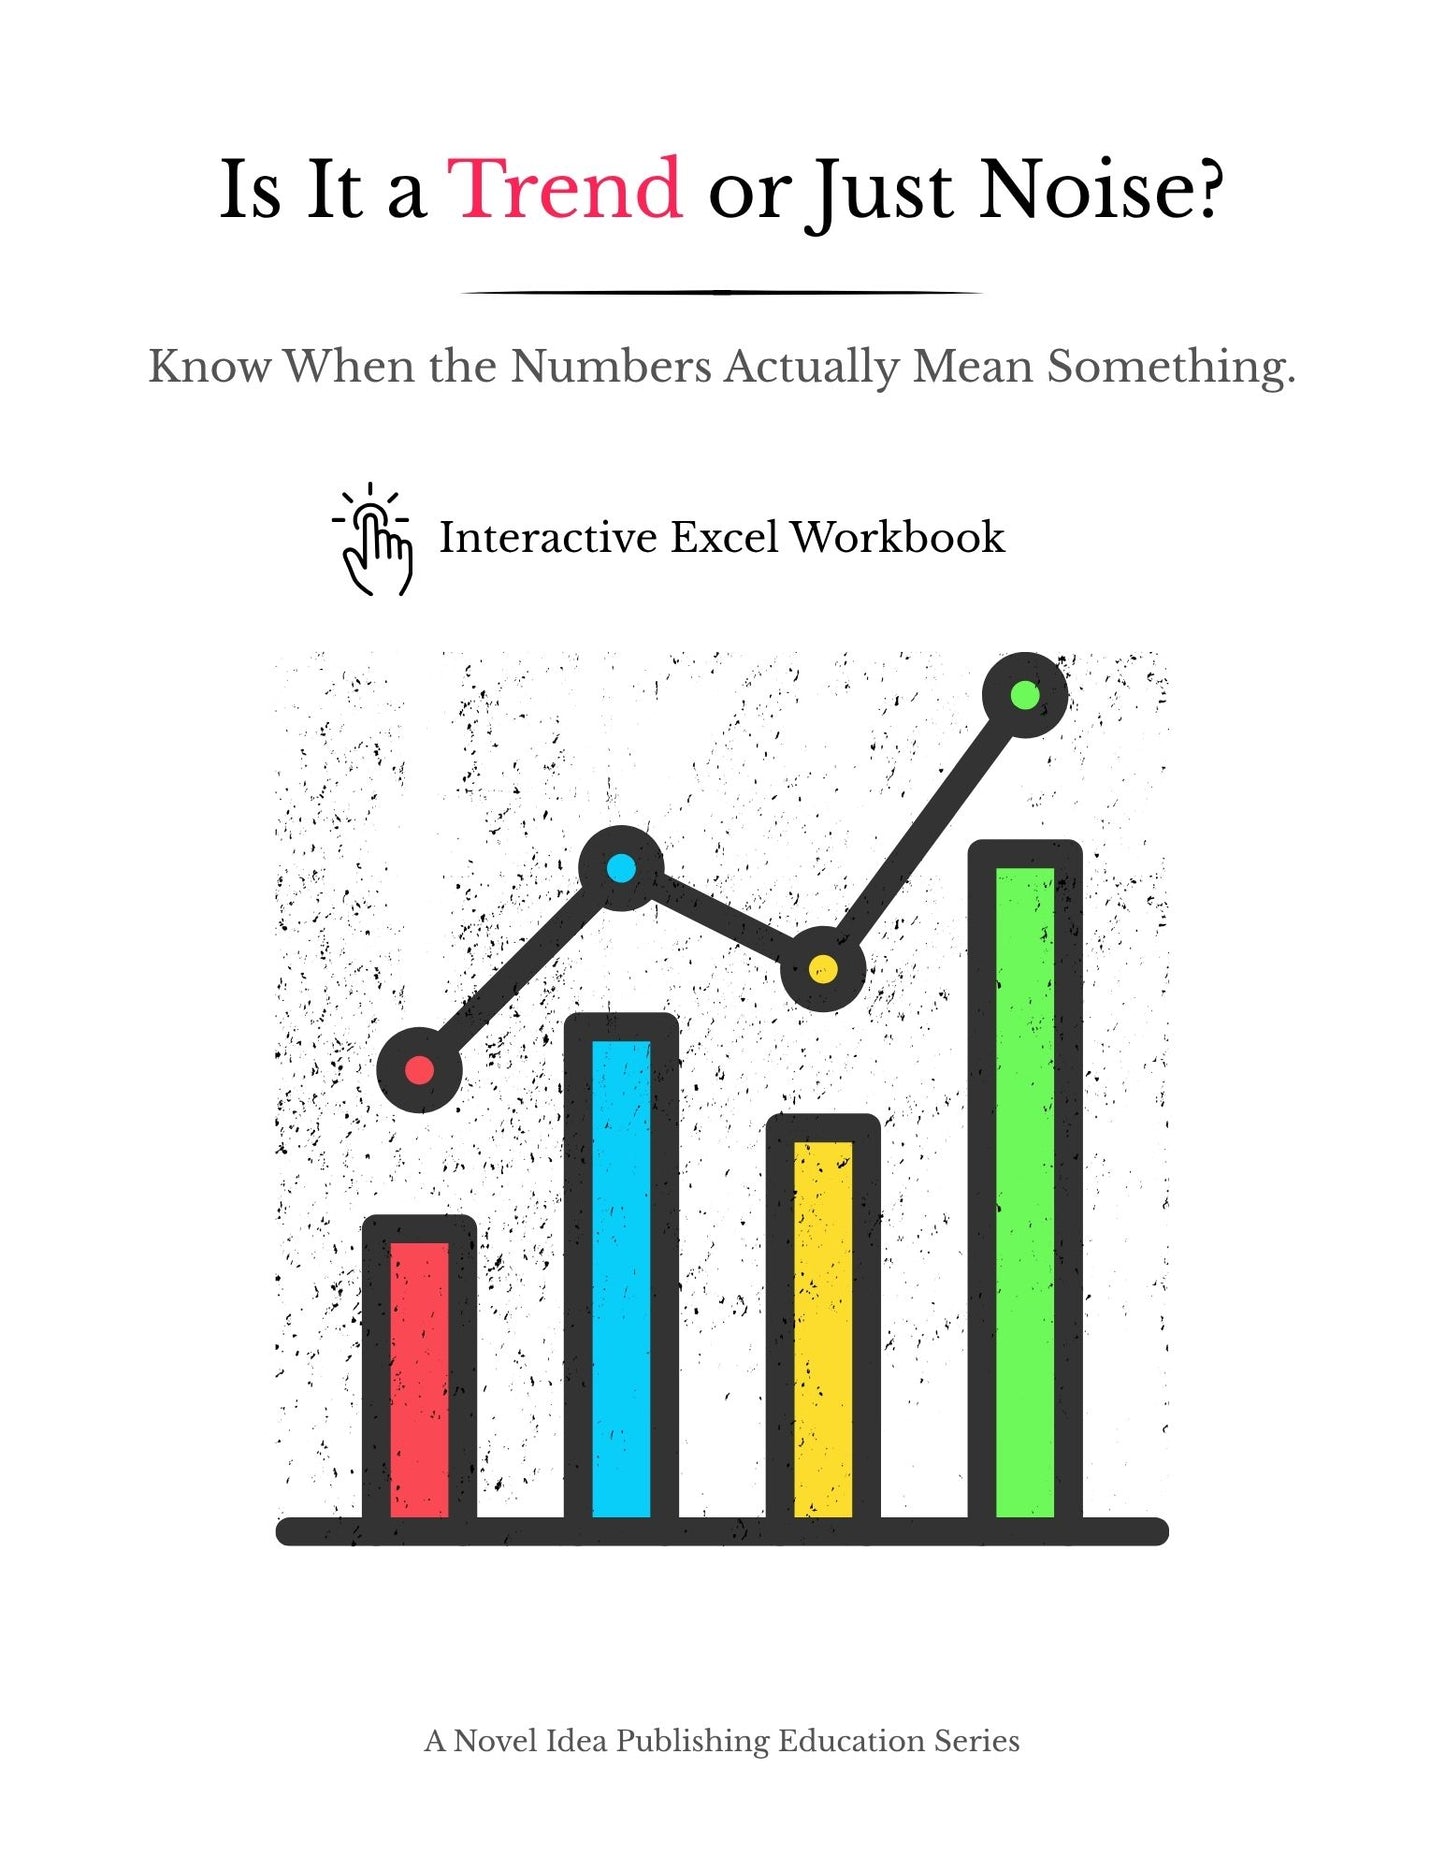
Is It a Trend or Just Noise?
Is It a Trend or Just Noise?
Couldn't load pickup availability
INSTANT DIGITAL DOWNLOAD!
An Author Sales Trend Analyzer
Know When the Numbers Actually Mean Something.
Your sales dropped this month.
Is your series actually declining?
Or… did you just have a bad month?
Is It a Trend or Just Noise? is an interactive Excel workbook designed to help independent authors distinguish ordinary fluctuations from patterns that may actually deserve their attention.
Enter 8–24 consecutive weekly or monthly observations, and the workbook analyzes your results against your own historical performance—so you’re not making business decisions based on one unusually good or bad data point.
What Can You Analyze?
Use the workbook with virtually any consistently measured author-business metric, including:
- Revenue
- Units sold
- KENP
- Direct-store sales
- Advertising results
- Series performance
- Or another metric you want to track
No statistics background required.
What the Workbook Analyzes
The workbook automatically calculates and displays:
- Period-over-period percentage change
- 3-period moving average
- 6-period moving average
- Historical baseline
- Variation around your baseline
- Recent performance compared with baseline
- Visual trends over time
You can also flag important events—including book releases, promotions, BookBubs, advertising changes, price changes, and seasonal events—so unusual results can be considered in context.
And Most Importantly: It Tells You What You’re Looking At
Instead of handing you a chart and expecting you to interpret it yourself, the analyzer categorizes your current data as:
NORMAL FLUCTUATION
There isn’t clear evidence of sustained movement in either direction.
POSSIBLE POSITIVE MOVEMENT
Your results may be moving upward, but there isn’t enough sustained evidence yet to call it a positive trend.
POSSIBLE NEGATIVE MOVEMENT
Your results may be moving downward, but it’s too early to call it a negative trend.
POSITIVE TREND
Growth appears sustained enough to investigate what’s driving it—and whether what’s working could potentially be supported or scaled.
NEGATIVE TREND
Decline appears sustained enough to investigate what has changed before deciding how to respond.
Built for Authors Who Aren’t Statisticians
You don’t need to know what a standard deviation is.
That’s my job.
I’m both an independent author and a statistics professor, and I built this tool to translate the numbers into information an author can actually use.
Because “sales fell 18%” and “my series is in a meaningful downward trend” are not the same statement.
And reacting to them as though they are can lead to some very expensive business decisions.
What You’ll Receive
1 downloadable interactive Microsoft Excel workbook (.xlsx) including:
- Trend Analyzer
- Visual trend chart
- Moving-average analysis
- Baseline comparison
- Context tracking
- Automatic plain-language interpretation
- Interpretation guide
- Built-in instructions and sample data
Replace the sample data with your own figures and let the workbook do the analysis.
Please note: This workbook uses descriptive statistical methods as a business decision-support tool. It does not perform formal statistical hypothesis testing and does not diagnose the cause of changes in your business.
About Nellie H. Steele
Nellie H. Steele is an award-winning author of mysteries, romances, and adventures filled with unforgettable characters who often steal the pen right out of her hand. A lifelong bookworm and animal lover, she now spends her days surrounded by rescue pets while crafting twisty mysteries and soap-opera-style romances that keep readers hooked until the very last page. Escape into her books today—you just might find your next favorite character.